26 July, 2025
How does the Week ahead look like?
As a technical analyst, we only work on probabilities. Probability of winning. Where does this probability is arrived at? It is from the market vibe prevalent at the moment. Setups and trades come later.
Let us analyse how is the Market looking
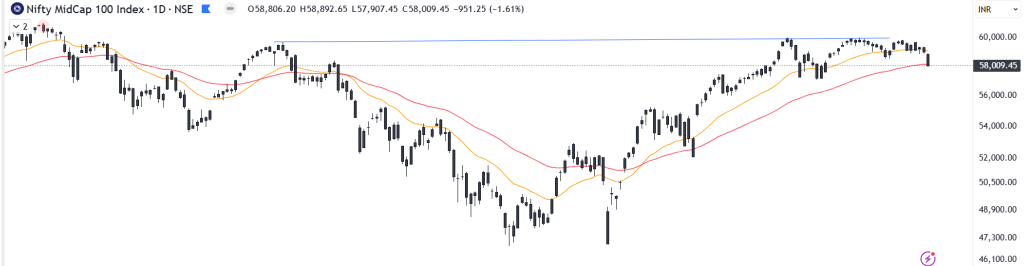
Nifty Mid cap 100
These are top 100 stocks in midcap space as defined by NSE/BSE. This index shows that price is at 50 EMA. It is a make or break for the index for next week.
Nifty Small cap 100
This index is top 100 stocks in small cap space. This shows breach of 50 EMA.
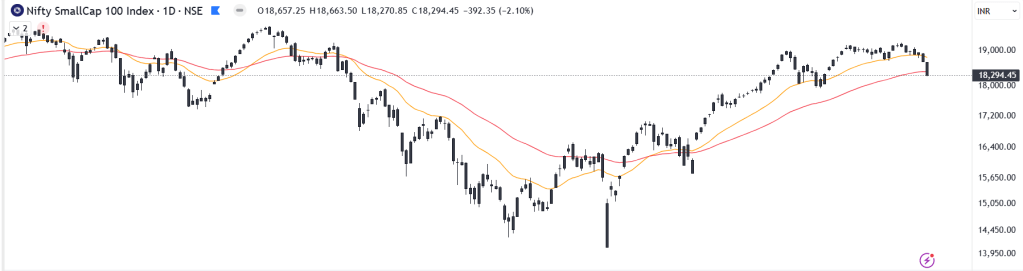
50 EMA (The Red line) is basically weighted average price of last 50 days. If price breaks this, the stock or index is considered to be weak in the short term. Ideally, to be avoided.
Joseph A. Schilling in 1930 spoke about EMAs. Further, Richard D. Wyckoff, Jesse Livermore, Welles Wilder, Mark Minervini have written about it. Basically it has historical precedent and is a simple tool to look at smoothed price data.
In Summary, we can see that as key indices of mid and small cap have broken the index, it is better to sit outside – In cash. Yes, there will be stocks that have not breached 20 or 50 EMA. We should be studying those. Basically, stocks which are standing tall when the majority market is moving lower. There can be fake breakouts and stocks will face headwinds to move ahead.
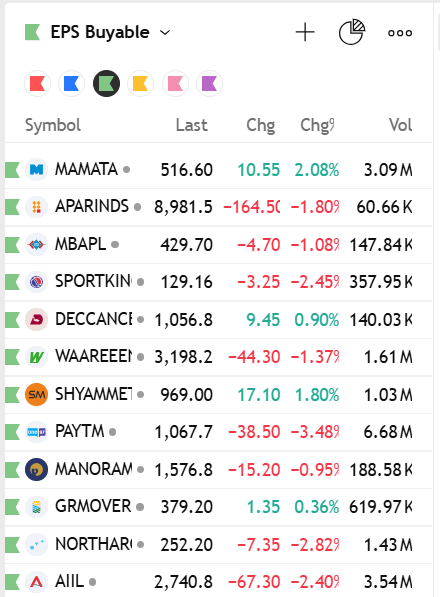
Below are stocks which are strong and can be watched this week.
These stocks have not breached 20 EMA
Happy Learning!

Leave a reply to Anonymous Cancel reply